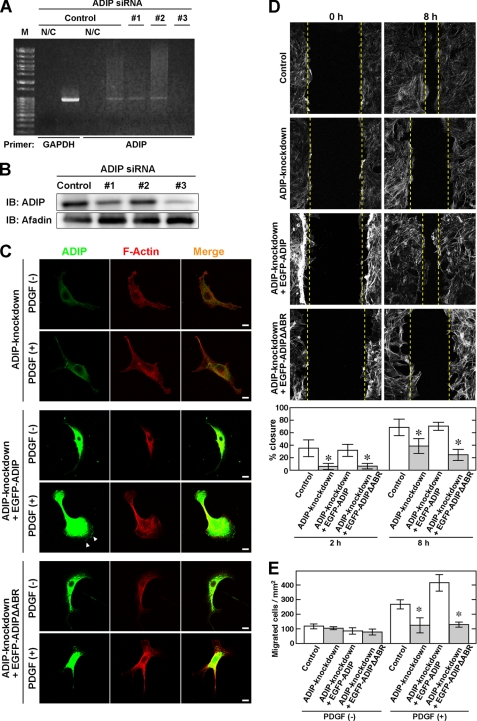
FIGURE 2.
ADIP-mediated formation of leading edge and cell movement. A and B, knockdown of ADIP in NIH3T3 cells. NIH3T3 cells were transfected with siRNA against ADIP (siRNAs 1, 2, and 3) or control siRNA (Control). Knockdown of ADIP was evaluated by RT-PCR (A) and Western blotting with the anti-ADIP pAb and the anti-afadin mAb (B). In RT-PCR experiments, GAPDH was used as an internal control. N/C, RT-PCR was conducted without the reverse transcriptase; M, molecular weight markers; IB, immunoblot. C, inhibition of the formation of the leading edge by knockdown of ADIP. After serum starvation, NIH3T3 cells transfected with siRNA against ADIP (ADIP knockdown), ADIP knockdown NIH3T3 cells expressing siRNA-resistant EGFP-ADIP, and ADIP knockdown NIH3T3 cells expressing siRNA-resistant EGFP-ADIPΔABR were seeded on the μ-Slide VI flow dishes. ΔABR indicates the lack of the afadin-binding region. These cells were directionally stimulated with 30 ng/ml PDGF for 30 min from the bottom, then fixed, and stained with the anti-ADIP pAb. F-actin was labeled with fluorophore-conjugated phalloidin. D, cell movement estimated by the wound healing assay. Confluent cell monolayers of control NIH3T3 cells, ADIP knockdown NIH3T3 cells, ADIP knockdown NIH3T3 cells expressing EGFP-ADIP, or ADIP knockdown NIH3T3 cells expressing EGFP-ADIPΔABR were manually scratched and cultured for 8 h in the presence of 30 ng/ml PDGF. F-actin was labeled with fluorophore-conjugated phalloidin to determine the cell front. The dotted lines indicate the front of moving cells. The percent wound closure at 2 and 8 h after scratching was calculated as described under “Experimental Procedures.” E, cell movement estimated by the Boyden chamber assay. The four types of cells indicated in D were incubated on cell culture inserts coated with vitronectin in the presence of 30 ng/ml PDGF in the bottom well for 12 h. The number of cells that migrated into the bottom well was counted after the cells were stained with DAPI. The error bars in D and E indicate ± S.D. *, p < 0.05 versus control. The results shown are representative of three independent experiments.

