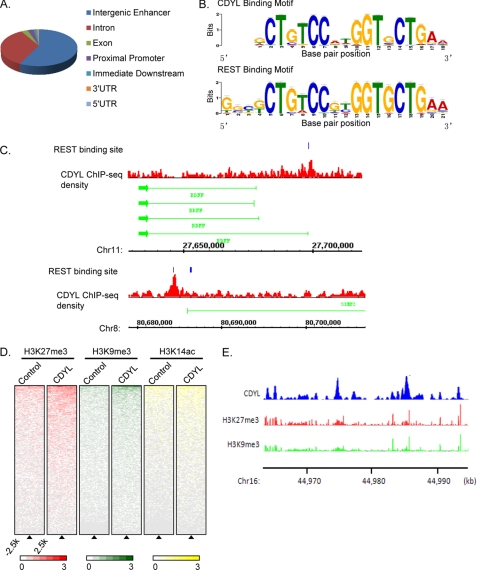
FIGURE 5.
Genomic landscape of CDYL binding sites determined by ChIP sequencing. A, genomic distribution of CDYL binding regions determined by CEAS. B, consensus CDYL binding motif is nearly identical to the REST binding motif. Motif screening was performed using MEME suite. C, examples of ChIP-seq identified CDYL binding to two REST target genes, BDNF (upper panels), and STMN2 (lower panels). Blue blocks represent REST binding sites as reported previously (48, 49). ChIP-seq density of CDYL is shown in red. The chromosome number and position of loci are shown below. D, ChIP-seq density heatmaps of histone H3K27 trimethylation (H3K27me3, red), H3K9me3 (H3K9me3, green), and H3K14 acetylation (H3K14ac, yellow) for CDYL binding sites and randomly distributed genomic regions (control). CDYL binding sites were aligned vertically along the center of each peak region called by MACS (indicated by triangle), and randomly selected genomic regions were used as controls. Each row represents a unique ChIP-seq peak region. The average ChIP-seq density of H3K27me3, H3K9me3, or H3K14ac was calculated within 250 bp bins around the genomic regions from −2.5 kb to +2.5 kb relative to each peak center. Heatmaps were arranged in descending order by the average ChIP-seq density per row. E, demonstration of ChIP-seq density of CDYL (blue), H3K27me3 (red), and H3K9me3 (green) at specific regions of chromosome 16. The position of loci is shown below the ChIP-seq density track.

