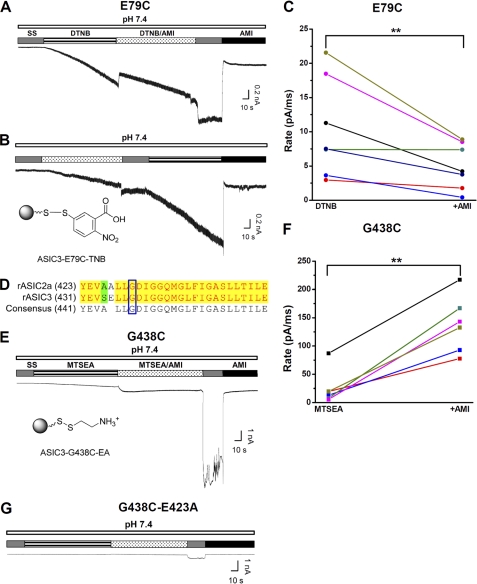
FIGURE 7.
Effects of AMI on covalently activated ASIC3 channels. A, typical recording showing the effect of AMI (1 mm) on 0.5 mm DTNB (pH 7.4)-induced ASIC3E79C activation as a result of a covalent modification (26). Notably, a successive coadministration of AMI (1 mm) and DTNB (0.5 mm at pH 7.4) slowed down the development of DTNB currents (see below) because of steric competition between AMI and DTNB. B, illustration of 5-thio-2-nitrobenzoic acid (TNB) covalently linked to E79C via a mechanism of Ellman's reaction (lower panel) and a typical recording showing the effect of AMI (1 mm) on DTNB-induced ASIC3E79C activation (upper panel) with a different drug application sequence from A. C, pooled data from the combination of experiments in A and B. The rate (pA/ms) is defined as the maximal current (pA) divided by the duration (ms) of covalent modification treatment as indicated. For AMI-treated, the maximal current during AMI washout (as indicated by SS) is measured to minimize the contribution of AMI-induced inhibition. Different colored points and lines represent paired measurements for individual cells. D, sequence alignment between rat ASIC2a (rASIC2a) and rat ASIC3 subunits. The blue open box indicates the conserved Deg site (Gly-430 versus Gly-438 in ASIC2a and ASIC3, respectively). E, illustration of 2-aminoethyl (EA) group covalently linked to G438C via a mechanism of Ellman's reaction (lower panel) and a typical recording showing the effect of AMI on 0.2 mm MTSEA (pH 7.4)-induced ASIC3G438C activation (upper panel). F, pooled data from the experiments in E. G, typical recording showing the attenuated effect of AMI on MTSEA-induced ASIC3G438C-E423A activation. Similar results were obtained in five other experiments.

