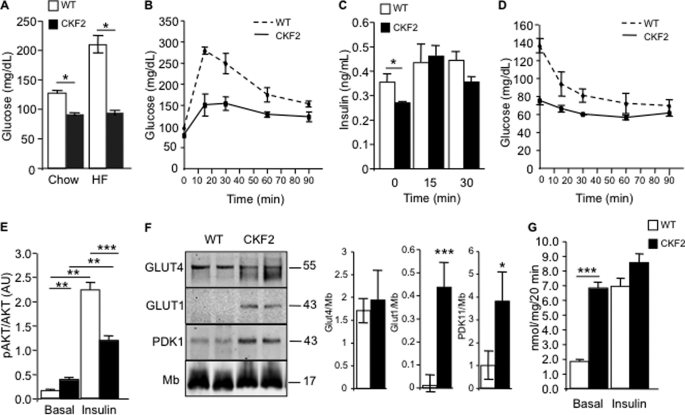
FIGURE 5.
CKF2 skeletal muscle has increased glucose transport. A, fasting glucose levels in 18-week-old WT and CKF2 mice fed SC or HFD. CKF2 exhibited decreased fasting glucose independent of diet. B, GTT showed that CKF2 mice fed SC exhibited increased glucose tolerance. C, plasma insulin levels before and after glucose challenge (1 g/kg intraperitoneally) for the times indicated. D, ITT indicated decreased response of CKF2 mice to insulin-fed SC. For GTT, ITT, and insulin measurements, data are represented as mean ± S.E.; n = 5 mice per genotype. E, phospho-AKT levels were quantified by Western blot analysis from isolated EDL muscles treated with or without insulin. Levels of phospho-AKT were normalized to total AKT. Data are represented as mean ± S.E.; n = 4 for each genotype and condition. AU, arbitrary units. F, levels of GLUT4, GLUT1, and PDK1 in quadriceps of WT and CKF2 mice fed SC. Myoglobin (Mb) levels were unchanged and served as a loading control. A representative Western blot and quantification are shown. Data are represented as mean ± S.E.; n = 4 mice per genotype. G, basal and insulin-stimulated glucose transport in isolated EDL muscle. Data are represented as mean ± S.E.; n = 4 mice per genotype per condition. *, p < 0.01; **, p < 0.001; ***, p < 0.0001.

