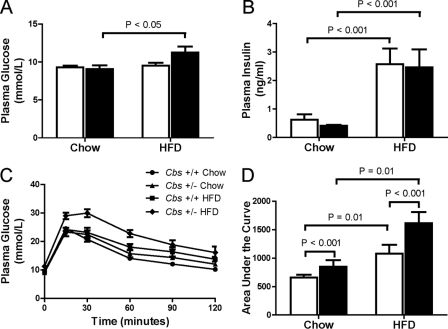
FIGURE 2.
Impaired glucose tolerance in Cbs+/− mice with diet-induced obesity. Fasting base-line plasma glucose (A) and insulin (B) are shown. C, plasma glucose concentrations following an i.p. injection of 2 g/kg glucose. D, area under the curve for plasma glucose levels during the 2-h intraperitoneal glucose tolerance test. Data are presented as means ± S.E., n = 5–6 mice per diet/genotype group. Open bars, Cbs+/+ mice; filled bars, Cbs+/− mice. Significance was determined by two-way ANOVA.

