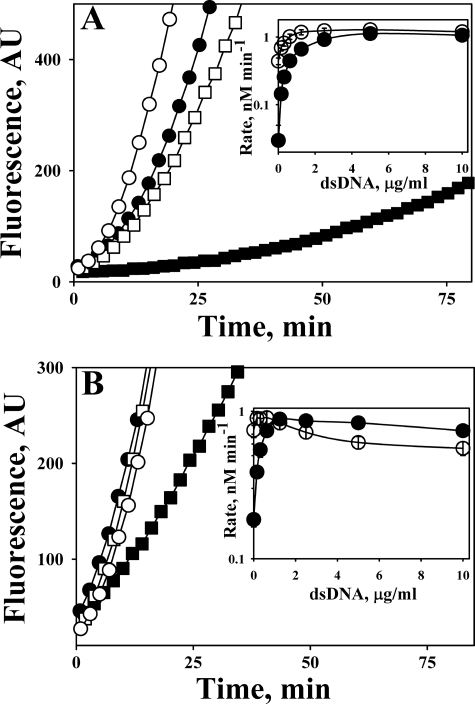
FIGURE 1.
Effects of salmon dsDNA on the activation of Glu-Plg (A) and Lys-Plg (B) by tctPA and tcuPA. Glu-Plg (A) or Lys-Plg (B) (0.2 μm) was incubated with 0.18 nm tPA (■) or 0.09 nm uPA (□) alone or with dsDNA (0.3 μg/ml) (●) and (○), respectively, in 0.05 m Hepes/NaOH buffer (pH 7.4) (room temperature). Plg activation was monitored by observing an increase in the fluorescence emission of 0.5 mm fluorogenic PL substrate using a Varian Eclipse spectrofluorimeter. Insets, dependences of the rate of PL generation from Glu-Plg (A) and Lys-Plg (B) by tPA (●) and uPA (○) on the concentration of dsDNA. The rates of PL generation (v) were calculated from the slopes of the linear dependences of the concentration of the product of the cleavage of fluorogenic PL substrate (Sf) on t2 that are equal to 0.5(B1)v, where B1 = kS1 [Sf]/(KS1m + [Sf]) as described under “Experimental Procedures.”

