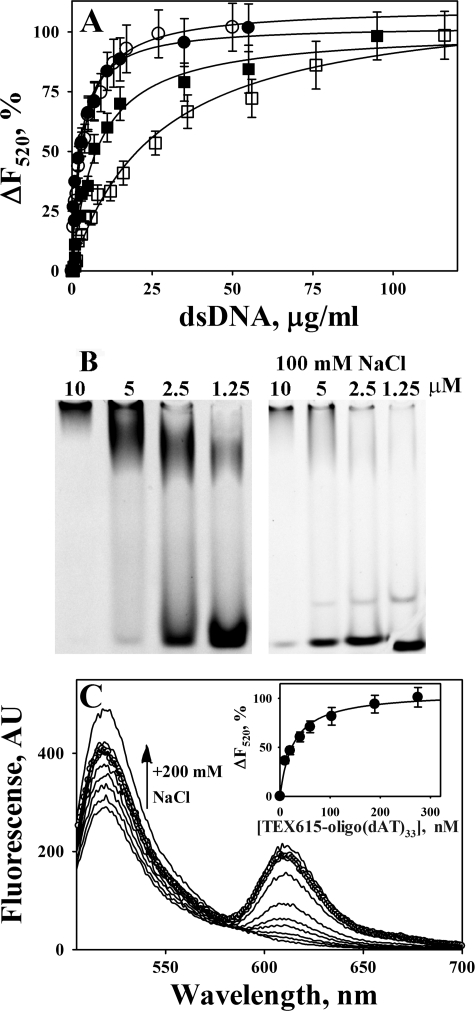
FIGURE 4.
Binding of WT and FITC-tctPA and FITC-tcuPA to oligonucleotides. A, dependence of the changes in the fluorescence emission at 520 nm (ΔF520) (excitation at 493 nm) on the dsDNA concentration for the equilibrium fluorescence titration of 20 nm FITC-tctPA and FITC-tcuPA in 0.05 m Hepes/NaOH buffer (pH 7.4). FITC-tctPA (●) and FITC-tcuPA (○) with 20 mm NaCl, FITC-tctPA (■), FITC-tcuPA (□) with 200 mm NaCl. ΔF520 were calculated as 100·(F − Fmin)/(F0 − Fmin), where F0, F, and Fmin are fluorescence emission at 520 nm without dsDNA, after the addition of dsDNA, and at saturation, respectively. Solid lines represent the best fit (r2 >0.90) of the hyperbolic equation ΔF520 = 100·(dsDNA)/(Kd + (dsDNA)), where (dsDNA) is the concentration of dsDNA in μg/ml, to the data using SigmaPlot 11.0. The values of the apparent dissociation constant Kd, which correspond to the concentration of dsDNA that induced half of the maximal quenching of the fluorescence emission, were 2.7 ± 0.5 and 4.2 ± 0.6 μg/ml for tctPA and tcuPA with 20 mm NaCl, and 14.3 ± 1.6; 32.0 ± 4.0 μg/ml for tctPA and tcuPA with 200 mm NaCl, respectively (Table 2). B, EMSA analysis of the interaction of TEX615-oligo(dAT)33 with tcuPA. Mixtures of 400 nm of TEX615-oligo(dAT)33 with increasing amounts of the enzyme (0–10 μm) in 10 μl of 10 mm Hepes (pH 7.4) (left panel) or 0.5× TBE (pH 8.0) buffer with 100 mm NaCl (right panel) were resolved by gel electrophoresis using a 6% DNA retardation gel, Invitrogen. The position of the oligonucleotides was visualized using a Molecular Imager supplemented with Quantity One (version 4.2.3) software (Bio-Rad) as described under “Experimental Procedures.” The upper band represents TEX615-oligo(dAT)33 co-migrating with tcuPA. The position of tcuPA was verified by staining with SimplyBlue, Invitrogen. EMSA analysis of mixtures of TEX615-oligo(dAT)33 with FITC-tctPA, FITC-tcuPA, and FITC-Plg directly demonstrated the co-migration of labeled protein and oligonucleotide in the top band (data not shown). The lower band represents free oligo(dAT)33. The concentration of the enzyme is indicated above the lanes. C, changes in the fluorescence emission spectrum of 20 nm FITC-tcuPA in the presence of increasing concentrations (0–270 nm) of TEX615-oligo(dAT)33. An arrow indicates the effect of an increase in the ionic strength on the fluorescence emission at 520 nm (200 mm NaCl was added to the mixture of 20 nm FITC-tcuPA and 270 nm of TEX615-oligo(dAT)33 (○)). Inset, dependence of the changes in the fluorescence emission at 520 nm (ΔF520) (●) (excitation at 493 nm) on [TEX615-oligo(dAT)33] for the equilibrium fluorescence titration of FITC-tcuPA. The values of ΔF520 were calculated as 100·(F − Fmin)/(F0 − Fmin), where F0, F, and Fmin are fluorescence emission at 520 nm without TEX615-oligo(dAT)33, after the addition of TEX615-oligo(dAT)33, and at saturation, respectively. The solid lines represent the best fit (r2 = 0.96) of the hyperbolic equation ΔF520 = 100·[TEX615-oligo(dAT)33]/(Kd + [TEX615-oligo(dAT)33]) to the data, using SigmaPlot 11.0. The value of the apparent dissociation constant Kd, which corresponds to the concentration of TEX615-oligo(dAT)33 that induced half of the maximal quenching, was 31 ± 5 nm (Table 2).

