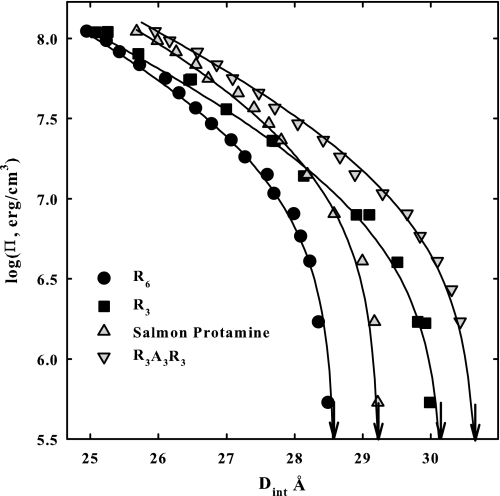
FIGURE 1.
Osmotic stress force curves are shown for DNA condensed by R6, R3 salmon protamine, and R3A3R3. Π is the osmotic pressure of PEG that is excluded from the DNA phase. DNA interaxial spacings are measured by x-ray scattering. The arrows indicate the equilibrium spacing in the absence of PEG. The solid lines are fits of the data to the double exponential function given by Equation 3, separating the overall force into its repulsive and attraction components. Note the convergence of the R6 and R3 data at high osmotic pressures indicating a similar 2.4 Å decay length repulsion. The different equilibrium spacings for R6 and R3 indicate different attractive force amplitudes. Similarly the high osmotic pressure data for salmon protamine and R3A3R3 are similar, indicating similar short range repulsions. Again the difference in equilibrium spacing for these two indicates different attractive force amplitudes. In addition to varied concentrations of PEG, the bathing solutions in equilibrium with the DNA phase contained 10 mm Tris-Cl (pH 7.5) and 100 μm of peptide or salmon protamine.

