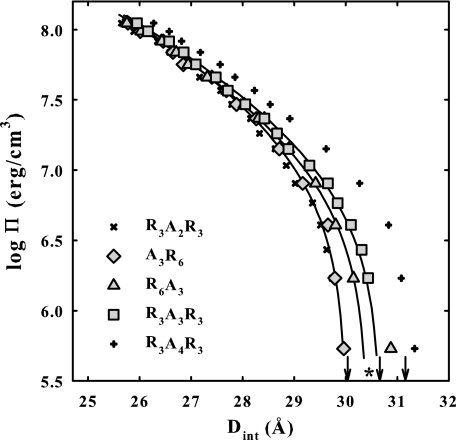
FIGURE 4.
Osmotic stress force curves are shown for DNA condensed by A3R6, R3A3R3, and R6A3. Force curves for DNA condensed by R3A2R3 and R3A4R3 are also shown for comparison. The arrows indicate equilibrium spacings in the absence of applied osmotic pressure for A3R6, R3A3R3, and R6A3 condensed DNA. The solid lines are the best fits to Equation 3. Placement of A3 makes little difference to the observed forces. The data with R6A3 show a transition at low pressures. The asterisk indicates the best fitting equilibrium spacing after the transition. Osmotic pressure and free energy contributions from the repulsive and attractive force components calculated from the fitting parameters are given in Table 1. The DNA pellet bathing solutions contained various concentrations of PEG, 10 mm Tris-Cl (pH 7.5), and 100 μm peptide.

