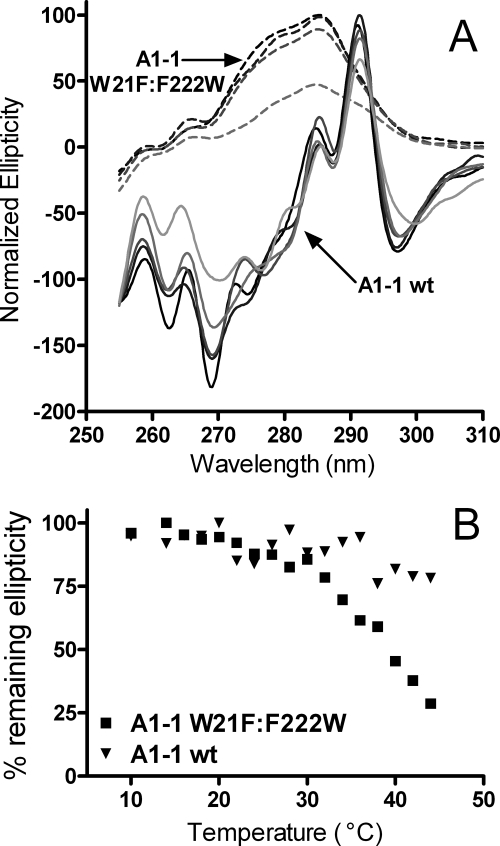
FIGURE 4.
Near-UV of wild-type GSTA1-1 and W21F/F222W GSTA1-1. A, WT GSTA1-1 spectra are in solid lines, and scans from 10 °C (black) to 40 °C in 10 °C increments and 44 °C (lightest gray) are shown. GSTA1-1 W21F:F222W spectra are represented by dashed lines, and spectra from 10 °C (black) to 40 °C in 10 °C and 44 °C (lightest gray) are shown. B, percentage remaining ellipticity is shown at maximum as a function of temperature. GSTA1-1 WT is indicated by triangles, and GSTA1-1 W21F/F222W by squares. Scans were taken of ∼50 μm protein in 20 mm potassium phosphate at pH 6.5.

