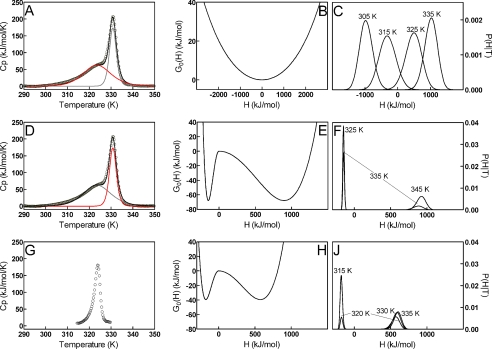
FIGURE 5.
DSC deconvolutions (left), free energy profiles (center), and probability distributions of enthalpic states (right) for GSTA1-1 and GSTA4-4. Top row, GSTA1-1 low temperature transition DSC data (A), free energy profile (B), and probability distributions (C). Middle row, GSTA1-1 high temperature transition DSC data (D), free energy profile (E), and probability distributions (F). Bottom row, GSTA4-4 DSC data (G), free energy profile (H), and probability distributions (J). DSC scans (left column, A, D, and G) used to obtain the free energy profiles (center column, B, E, and H) and probability distributions (right column, C, F, and J) are shown. The GSTA1-1 thermogram (A and D) was deconvoluted into a low temperature transition (A, red line) and a high temperature transition (D, red line). Data points are shown as open circles, and the overall fit as black lines. The deconvoluted transitions are shown as gray and red lines. GSTA4-4 DSC data (G) were used without deconvolution. Thermograms are shown after buffer scan subtraction, protein dimer concentration normalization, and native-state base-line analysis. The low temperature region fitted parameters recovered from the free energy profiles were Σα = 3664.7 kJ/mol, T0 = 318.8 K, β = −30 kJ/mol, and f = 1 (R2 = 0.9933). The GSTA1-1 high temperature unfolding transition parameters obtained were Σα = 1042.1 kJ/mol, T0 = 337.4 K, β = 67.8 kJ/mol, and f = 0.28 (R2 = 0.9900), giving a significant free energy barrier for unfolding to occur. The entire data set for GSTA4-4 was fit using the same method, with Σα = 749.6 kJ/mol, T0 = 324.9 K, β = 39.4 kJ/mol, and f = 0.47 (R2 = 0.9287).

