FIGURE 1.
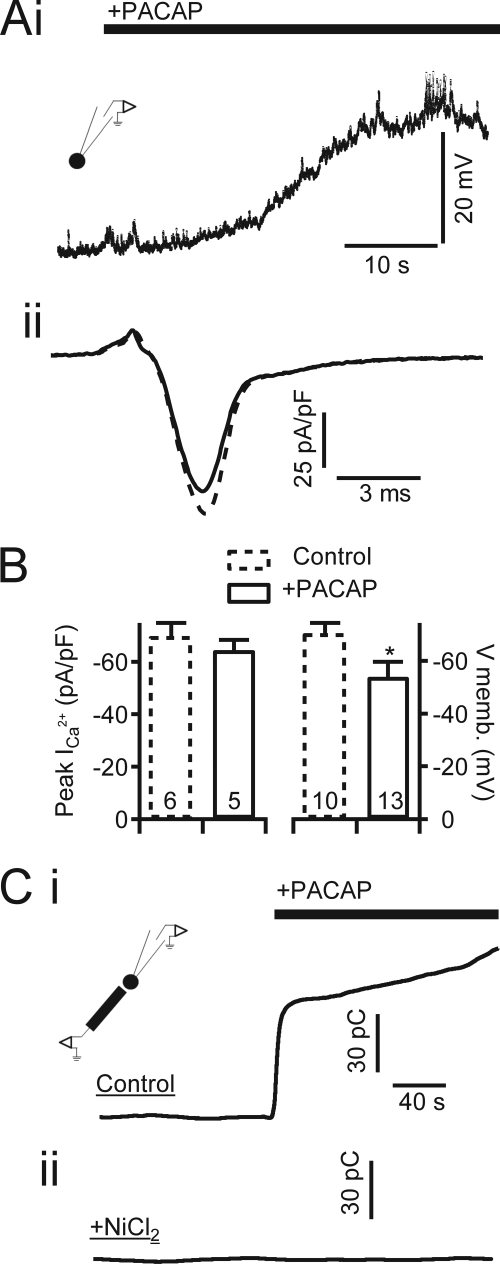
PACAP evokes membrane depolarization and nickel-sensitive catecholamine release. A, panel i, a chromaffin cell was held in perforated patch configuration, and membrane potential was measured under current clamp. Focal perfusion of PACAP (1 μm) is indicated by the bar. The inset icon indicates the patch clamp recording condition. A, panel ii, representative current recorded during perforated patch voltage clamp recordings of chromaffin cells stimulated with an action potential voltage template in control cells (dash line) or PACAP-treated cells (solid line). B, data quantified from pooled experiments such as in A show that PACAP stimulation does not significantly alter peak Ca2+ influx during the action potential but does cause a significant membrane depolarization to approximately −53 mV (PVm). Data are plotted as mean value, with error bars representing S.E. * indicates significance at p < 0.02 by Student's t test; sample size is indicated by numbers at the base of each category bar. C, carbon fiber amperometry was utilized to measure catecholamine release under PACAP stimulation. Total catecholamine release for each condition was determined by integrating the time-resolved amperometric traces. The inset icon indicates the amperometric recording condition. Panel i, in untreated “Control” cells, focal perfusion of 1 μm PACAP elicits a robust catecholamine release indicated by a rapidly rising integrated amperometric current. Panel ii, perfusion in Ringer's solution supplemented with 50 μm NiCl2 effectively blocks catecholamine release under PACAP stimulation. pF, picofarads; memb., membrane; pC, picocoulombs.

