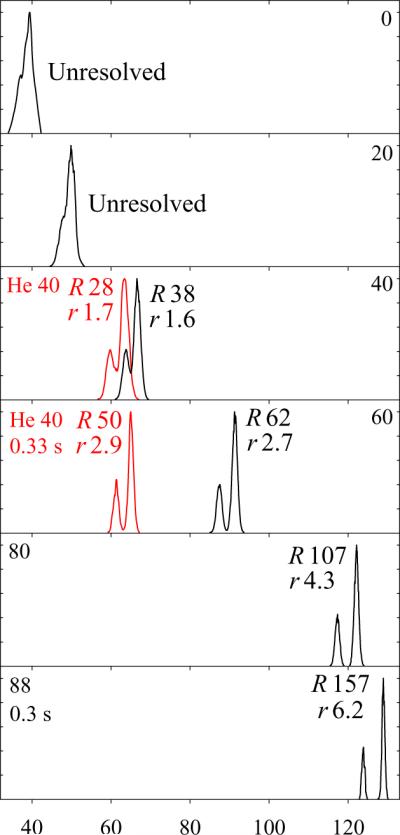
Fig. 3.

Separation of 1+ protonated nitropeptide isomers 3 and 4 (with nY shifted by single residue) in H2/N2 mixtures with 0 – 88% H2, as labeled, and filtering times of 0.2 s up to 80% H2 and as stated for >80% H2 (black lines). For comparison, the spectra in 40:60 He/N2 obtained26 using t = 0.2 s and 0.33 s are added (red lines) to the panels with similar peak resolution in H2/N2. The isomer 3 always has a lower EC. The R and r values are marked. Date for more H2 fractions are shown in Fig. S4.
