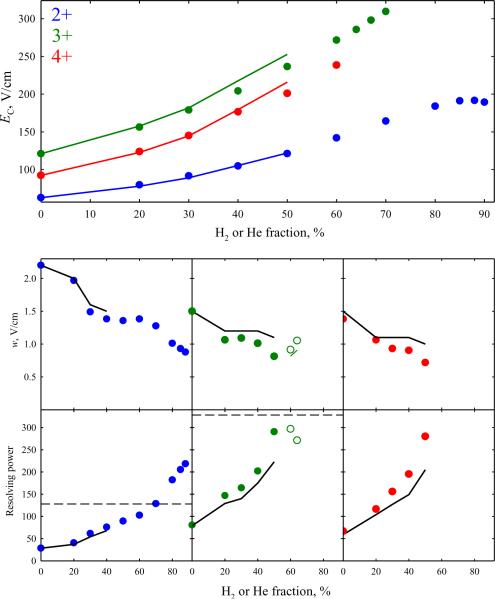
Fig. 4.
Separation properties for major peaks of protonated Syntide 2 with z = 2 – 4 in H2/N2 and He/N2 mixtures: compensation field (top panel), peak widths (middle row), and resolving power (bottom row). Black lines are for the data24 in He/N2 and circles are for H2/N2: filled for t = 0.2 s, blank (middle and bottom rows) for z = 3 at t = 0.15 – 0.16 s. The green line (middle row) shows the peak widths for z = 3 upon adjustment to t = 0.2 s as explained above. The dashed lines (bottom panel) indicate the maximum R achieved36 for z = 2 and 3 with He/N2 mixtures (using t = 0.5 s).

