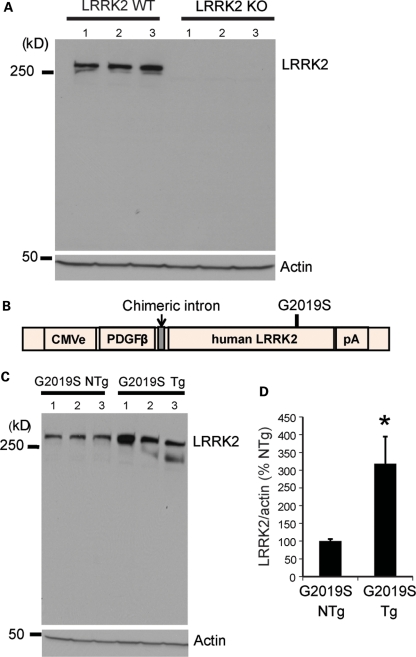
Figure 1.
LRRK2 protein expression in LRRK2 KO and G2019S transgenic mice as determined by western blot analysis. (A) Three LRRK2 WT and three LRRK2 KO mice. (B) Schematic showing the CMVe-PDGF-β LRRK2 transgene and the position of the G2019S mutation. (C) Three LRRK2 G2019S transgenic (Tg) and three their non-transgenic (NTg) litter mate mice. (D) Fold overexpression and total LRRK2 were normalized to actin and expressed as the percentage of NTg controls with bars representing the mean ± SEM from n = 3 mice per genotype. Data were analyzed for statistical significance by the two-tailed unpaired Student's t-test against NTg controls (*P < 0.05).

