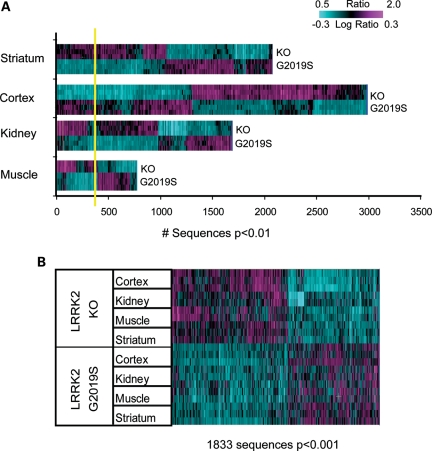
Figure 3.
Direct comparison of LRRK2 G2019S and KO mRNA expression tested after normalization to corresponding NTg and WT controls in the striatum, cortex, kidney and muscle reveals robust differences across tissues. (A) The results of one-way ANOVA run in each tissue type separately. Sequences expressed at P < 0.01 were used for 2D hierarchical clustering with agglomerative algorithm. The estimated FDR was much lower compared with within-study comparisons of LRRK2 G2019S versus NTg and LRRK2 KO versus WT (see Results and Fig. 2 for details). 100% estimated FDR is shown as yellow line. (B) 2D agglomerative hierarchical clustering of all tissue samples using LRRK2 genotype signature (1833 transcripts; two-way ANOVA, P < 0.001). Horizontal lines on the heatmap represent biological replicates for each animal model.

