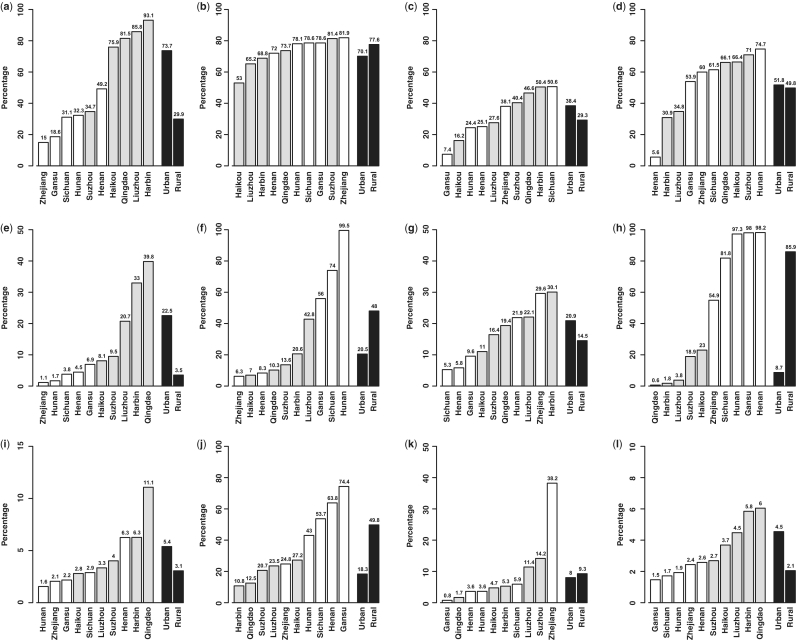
Figure 3.
Variation of selected baseline variables across 10 study areas. Adjusted for age and for male and female combined results, additional adjustment was also made for sex. (a) Overall: per cent with ≥6 years education; (b) men: per cent ever-regular smokers, (c) men: per cent drinking alcohol weekly, (d) men: per cent drinking tea regularly; (e) overall: per cent consuming dairy food regularly; (f) overall: per cent eating spicy food regularly; (g) overall: per cent taking food supplements; (h) overall: per cent using smoky cooking fuel; (i) overall: per cent obese; (j) women (65–74 years): per cent with five or more live births; (k) women (35–44 years): per cent using oral contraceptives; and (l) overall: per cent with diabetes reported. Open bars indicate rural areas and grey bars indicate urban areas

