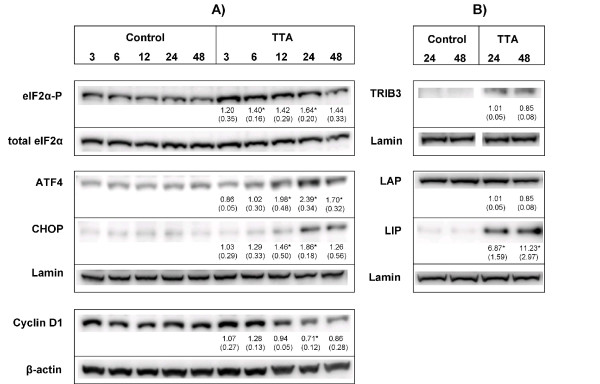
Figure 2.
TTA induces proteins involved in ER stress and UPR. SW620 cells were treated with TTA (75 μM) or NaOH (control) for indicated time periods, and proteins were quantified by western blotting. (A) Analysis of eIF2α-P and Cyclin D1 from cytosolic protein extracts and ATF4 and CHOP from nuclear protein extracts. (B) Analysis of TRIB3 and the C/EBPβ protein isoforms LAP (45 kDa) and LIP (20 kDa) from nuclear protein extracts. Blots were quantified, and band intensities normalized relative to the respective loading control; β-actin (Cyclin D1), Lamin (nuclear extracts) or total level of eIF2α (eIF2α-P), to adjust for unequal protein loading within the membranes. Band intensities were related to the 24 h control band to adjust for differences in signal intensities between the membranes, except for TRIB3 where the band intensities are related to the 24 h TTA band (not expressed in control). Quantified results show mean fold change (± SD) of TTA-samples relative to control at indicated time periods for three independent experiments. One representative blot is shown. * Significantly different from control (one-tailed Student's t-test, P < 0.05).

