
Figure 2.
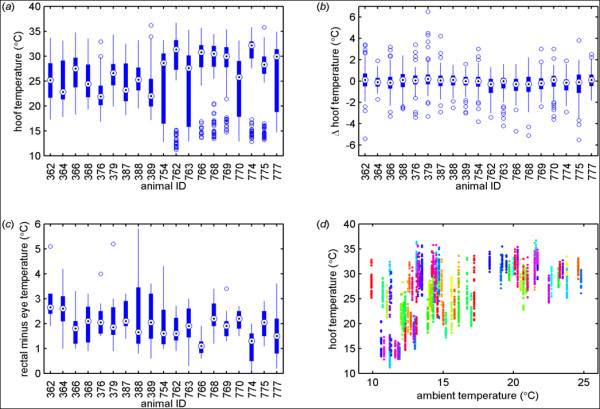
Summary of data extracted from thermal images. (a-c) Box-and-whisker plots showing: (a) distribution of hoof temperatures for each animal; (b) differences in hoof temperature measured by replicated thermal images for each animal; and (c) differences between rectal and eye temperature for each animal. Each plot shows the median (target), interquartile range (blue box), 1.5-times the interquartile range (whiskers) and any outliers (circles). (d) Scatter plot showing hoof temperatures and their dependence on ambient temperature. The plot shows the data for all animals, with each animal indicated by a different coloured point.