
Figure 3.
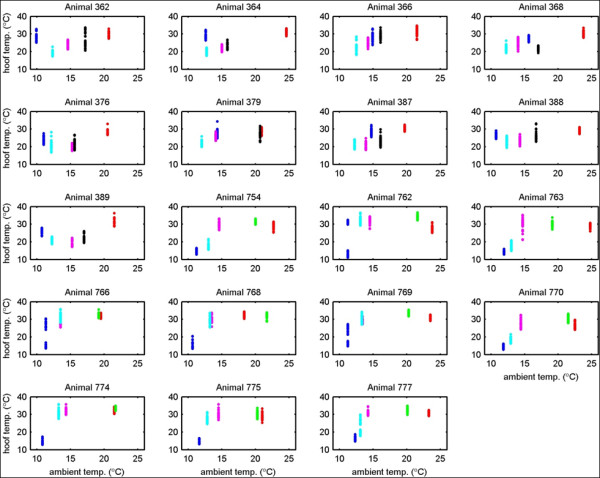
Scatter plots showing hoof temperatures and their dependence on ambient temperature for the 19 animals in the study. Colours in the plots indicate the date of measurement: 23/07/2009 (red); 26/08/2009 (green); 04/09/2009 (black); 08/10/2009 (blue); 22/10/2009 (magenta); and 19/11/2009 (cyan). The data for each day comprise all observations (up to 33) of all hooves from all camera aspects.