
Figure 4.
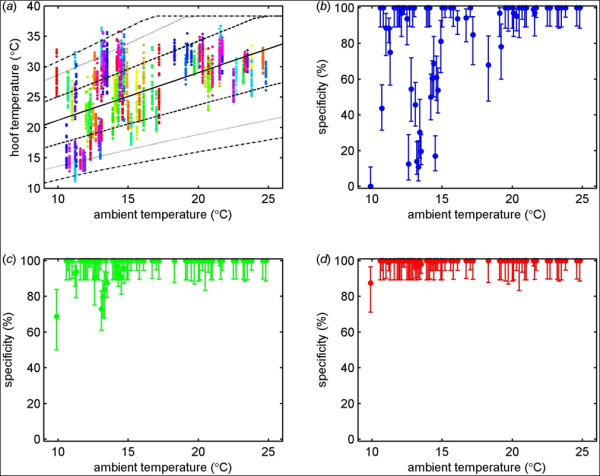
Posterior predictions for hoof temperature and the definition of a threshold temperature for healthy cattle. (a) posterior median (solid line), 25th and 75th percentiles (dashed lines), 10th and 90th percentiles (dotted line) and 5th and 95th percentiles (dash-dotted lines) for hoof temperature at different ambient temperatures based on a model of hoof temperature including ambient temperature, hoof and aspect. The points show the observed hoof temperatures, with each animal indicated by a different coloured point. (b-d) Specificity when classifying cattle as healthy based on a threshold defined by the (b) 75th, (c) 90th or (d) 95th percentile for the posterior predictions of hoof temperature. Each plot shows the estimated specificity (circles) and 95% confidence limits (error bars).