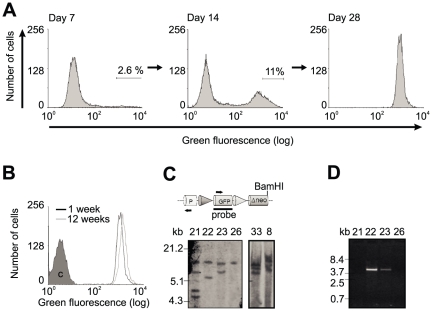
Figure 2. Generation of master cell lines.
(A) Selection of CHO Lec3.2.8.1 cells upon transfection with the GFP tagging vector pEF-FS-EGFP-dneo. One week post transfection, the top 2.6% fluorescent cells were isolated. Of these cells, the top 11% fluorescent cells were isolated as single cells one week later. The fluorescence profile of a representative cell clone is shown. (B) Fluorescence profile of a representative tagged cell clone in comparison to parental CHO Lec3.2.8.1 cells (marked with ‘C’). The GFP fluorescence of the tagged cells was observed over 12 weeks without measuring a reduction in fluorescence strength. (C) Southern blot analysis of integrated tagging vector copy numbers in six potential master cell clones. Genomic DNA was digested by BamHI, blotted and probed for GFP. Multiple bands indicate integration at multiple chromosomal sites. (D) PCR test for concatemers in four potential master cell clones. Primers are marked by horizontal arrows in panel C. PCR products were obtained only in the presence of tandem repeats. Cones = FRT sites (dark = F3, light = wild type).

