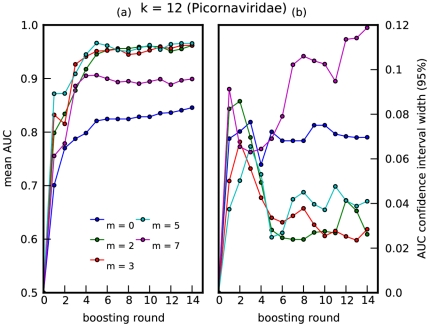
Figure 1. Prediction accuracy for Picornaviridae.
A plot of (a) mean AUC vs boosting round, and (b) 95% confidence interval vs boosting round. The mean and standard deviation were computed over 10-folds of held-out data, for Picornaviridae, where  . Boosting round 0 corresponds to introducing the offset term into the model. Thus, the boosting round can also be interpreted as one-half the number of decision rules (one-half because each round introduces a decision rule and its negation into the model).

