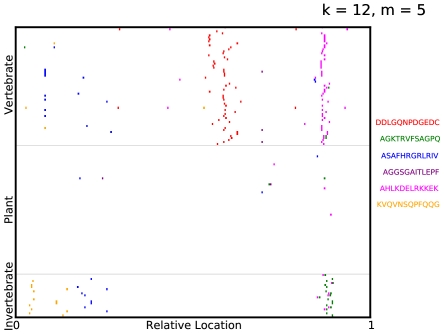
Figure 3. Visualizing predictive subsequences.
A visualization of the mismatch neighborhood of the first 6  -mers selected in an ADT for Picornaviridae, where
  . The virus proteomes are grouped vertically by their label with their lengths scaled to
  . Regions containing elements of the mismatch neighborhood of each
  -mer are then indicated on the virus proteome. Note that the proteomes are not aligned along the selected
  -mers but merely stacked vertically with their lengths normalized.

