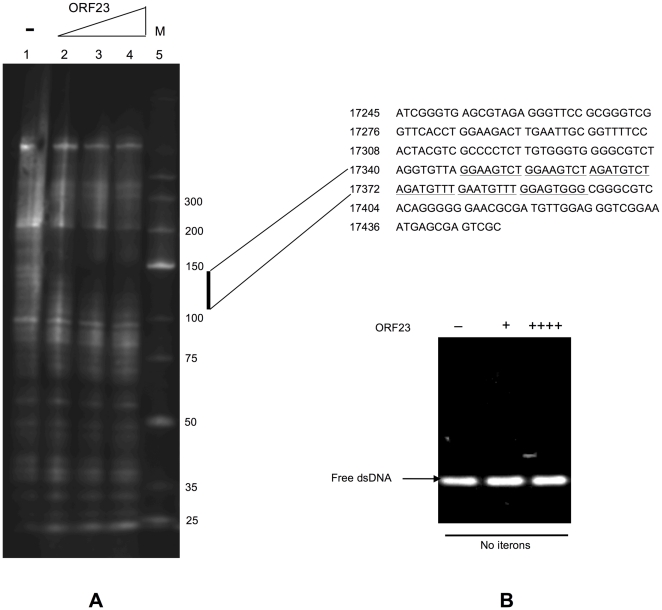
Figure 4. DNA-binding activity of ORF23.
(A) DNase I footprinting analysis of the binding activity of ORF23 with the DNA fragment corresponding to nt 17242–17447 upstream of the par operon of pMF1. After incubation, the mixture was partially digested with DNase I and separated using denaturing gel electrophoresis. Lanes 1 to 4 contained 0, 250 ng, 1250 ng, and 3750 ng of ORF23, respectively. The ladder marker was in lane 5. The bar on the right indicates the tested DNA fragment containing the protected region of the iterons (underlined). (B) Electrophoretic mobility shift assays (EMSAs) showing the no DNA binding activity of ORF23 to non-iteron fragment nt 17395–17447. The concentration of labeled DNA used in each lane was 12 pmol. The amounts of purified ORF23 added in lanes 1 to 3 from left to right were 0 (−), 250 ng (+) and 1000 ng (++++), respectively.

