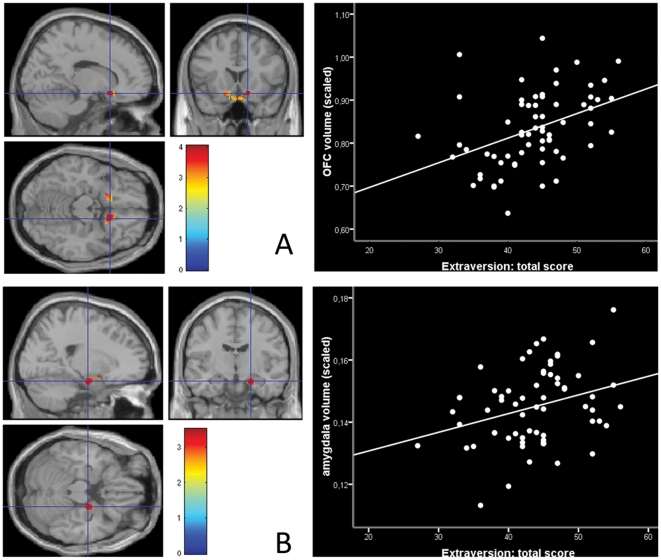
Figure 1. Correlations of Extraversion and volume in the OFC and amygdala.
A) Positive correlation of extraversion and volume of the right orbital frontal gyrus scaled for total gray matter volume (r = .33; rpartial = .47 when neuroticism and age were partialled out) . B) Positive correlation of extraversion and right amygdala volume scaled for total gray matter volume (r = .31, rpartial = .39 when neuroticism and age were partialled out). Mean volume in ml of the significant voxels was extracted per subject and divided by total GM volume. In the correlation plots, mean volume of the significant amygdala and ofc region is depicted in scaled volume in ml * 10−3.

