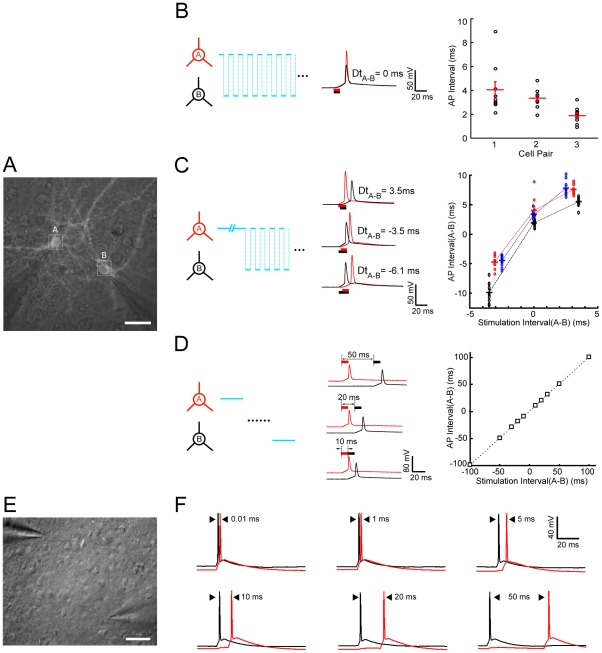
Figure 3. Temporal control of AP firing in two neurons.
(A) Fluorescence image of two cultured ChIEF-expressing cortical neurons with dual whole-cell recording. Scale bar, 20 µm. (B) Synchronous activation of two cells using alternating scanning at random spots on the soma (depicted on the left). Traces are example recordings of coincident APs evoked by alternating stimulation of the two recorded cells. (C) Sequential activation of two cells with millisecond intervals by continuous random-scanning stimulation of the first cell for a defined duration, followed by alternating scanning stimulation of both cells (depicted on the left). Traces are example recordings of sequential AP firing in same cell pairs evoked by different stimulation patterns intended to induce specific intervals and spiking order. The plot on the right summarizes the results obtained from three recorded cell pairs and depicts the relationship between the intended and observed spiking intervals in two cells. Negative intervals represent spiking of the opposite order. (D) Sequential activation of two cells with intervals longer than 10 ms was achieved by complete whole-soma scanning stimulation of the first cell followed by stimulation of the second. Traces are example recordings of sequential AP firing in same cell pairs evoked by sequential whole-soma stimulation at different intervals. The plot summarizes results obtained from three recorded cell pairs and depicts the relationship between the intended and observed spiking intervals in two cells. (E) Bright-field image of two ChR2-expressing pyramidal cells in the S1 slice prepared from the AAV injected mouse (P60). Scale bar, 50 µm. (F) Similar to (D), Sequential AP firing of this PC pair was evoked at the inter-stimuli intervals of 0.5, 1, 5, 10, 20, and 50 ms respectively.

