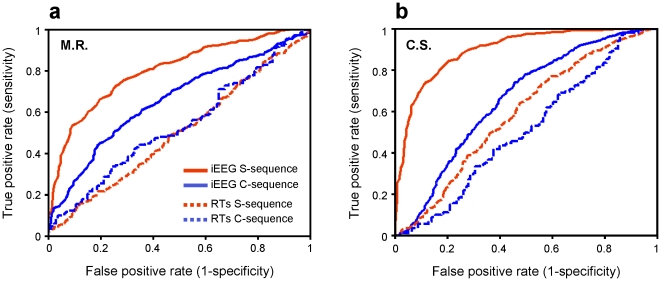
Figure 3. Classification results.
ROC curves for M.R. (a) and C.S. (b) representing the classification results when taking into account all contacts, comparing the iEEG data from S-sequence (plain red line) and those from the C-sequence (plain blue line). The same model was used to classify reaction times from the S-sequence (dotted red line) and from the C-sequence (dotted blue line). Accuracy for classifying single-trials belonging to S-sequence was always significantly higher than that for the C-sequence and for the reaction times, suggesting that the classification algorithm captured information in the signal that was specific for the trained visuomotor sequence.

