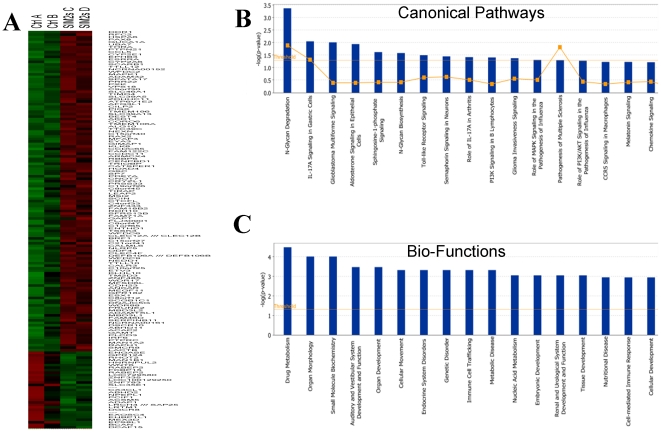
Figure 3. Heat map and cell signaling analysis for the dysregulated genes in SIM2low comparing to control PC3 cells.
A. Control A: PC3 luciferase shRNA; Control B: PC3 PLKO vector; SIM2 C: SIM2 sh48; SIM2 D: SIM2 sh51. Gene expressions were either up or down greater than 2 fold in the SIM2low were listed. B. Top dysregulated signaling pathways in SIM2low PC3 cells. C. Top dysregulated cell functions in SIM2low PC3 cells.

