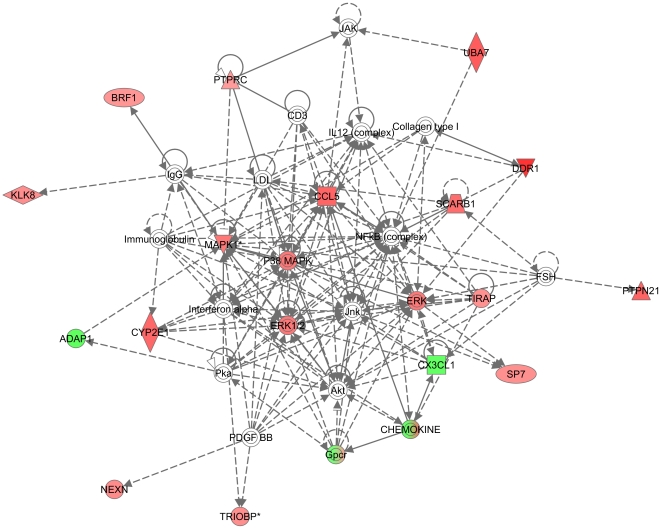
Figure 4. Top one network dysregulated in SIM2low.
This network contained 16 focus genes with a score of 29. Different shapes of the node represent different groups of the focus genes. The intensity of the node color indicated the degree of the up (red) and down (green) gene expression level. The top functions of this network are cellular movement, immune cell trafficking, organismal injury and abnormalities.

