
Figure 7.
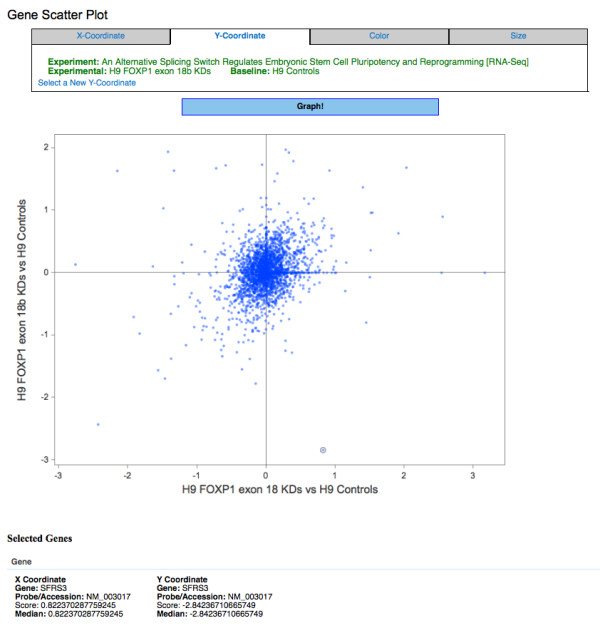
Scatter plot of sample RNA-Seq data. The log2 expression fold change of the exon 18b KD vs. control is displayed on the y-axis and exon 18 KD samples vs. control is displayed on the x-axis. Details of the selected SFRS3 gene is shown below the plot.