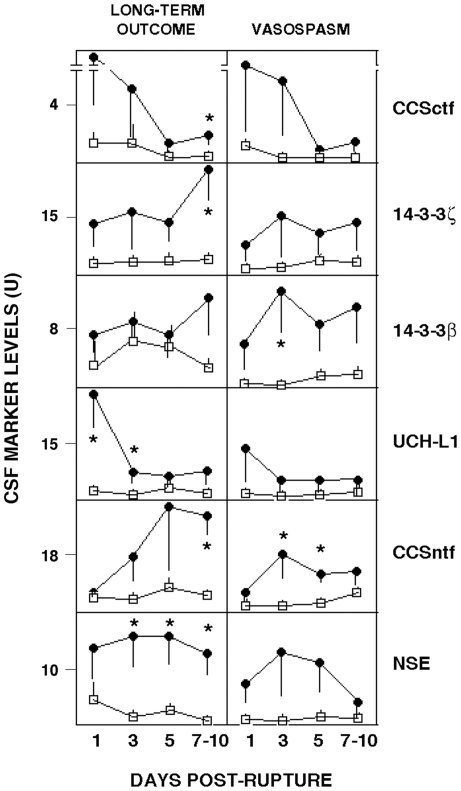
Figure 3. Time courses for 6 CSF neurodegeneration biomarkers in relation to functional outcome and the severity of cerebral vasospasm.
Long-term outcome was dichotomized to either poor (closed circles: GOS-E = 1–4; mRS = 4–6) or good (open boxes: GOS-E = 5–8; mRS = 1–3), while angiographic vasospasm was categorized as either moderate/severe (closed circles) or absent/mild (open boxes) as described in Methods. Mean CSF levels of each neurodegeneration biomarker at the indicated times post-aneurysm rupture (in days) are shown with the standard error of the mean. Statistically significant between-group differences (p<0.05) are identified by asterisk. In cases for which CSF samples were available at both 7 and 10 days post-rupture, the higher marker level was considered.

