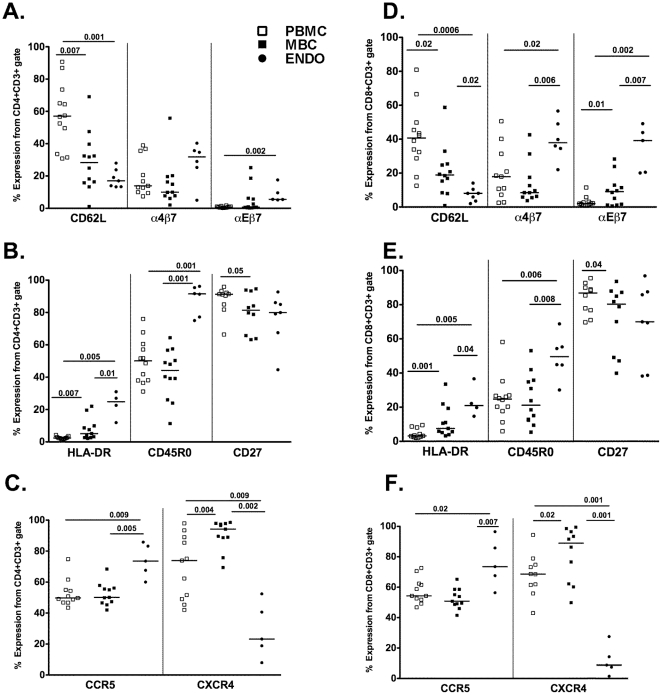
Figure 4. Surface marker expression on PBMC, MBC, and cells from endometrial tissue.
Surface markers on CD3+CD4+ cells are shown for panels A–C and on CD3+CD8+ on panels D–F. The median data from peripheral and menstrual blood is shown for 12 healthy women. Endometrial tissue from 7 women was available for several analyses; however, for some samples, data from only four samples was obtained. Comparisons were made using Wilcoxon Signed Rank test and Mann Whitney U test for paired and unpaired samples, respectively.

