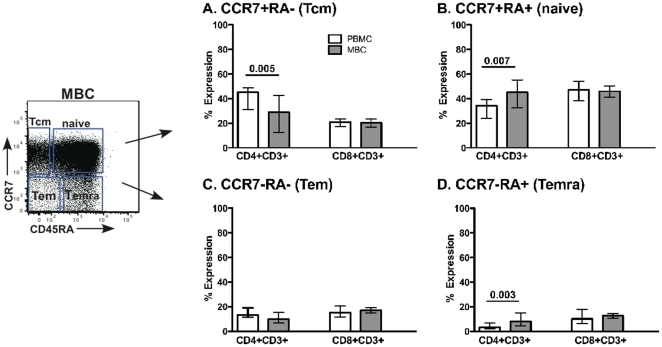
Figure 5. Memory marker expression.
CCR7 and CD45RA surface staining was performed on both CD3+CD4+ and CD3+CD8+ T cells from PBMC and MBC. A–D represent samples gated on different populations of cells CCR7 and CD45RA expression. The median and interquartile range data is shown for 12 healthy women. Tcm = central memory, Tem = effector memory, and Temra = effector memory RA+. Comparisons were made using Wilcoxon Signed Rank test.

