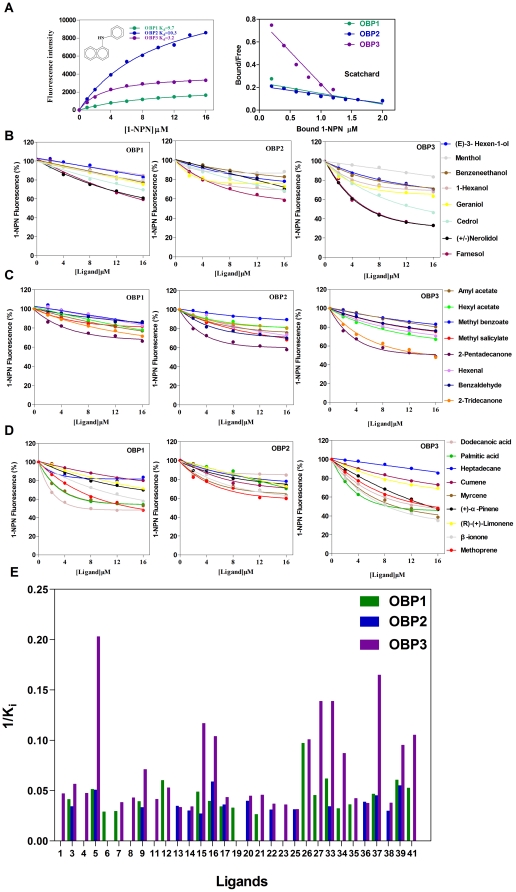
Figure 6. Ligand-binding assay of three NlugOBPs.
(A) Binding curves of 1-NPN (Left) and relative Scatchard plot analyses (Right). (B-D) Competitive binding curves of three OBPs with Alcohols (B), Aldehydes, Esters and Benzoates (C), and Carboxylic acids, Alkane and Terpenes (D). (E) Comparison of binding ability (indicated by 1/Ki values) of three OBPs with 31 compounds. Numbers representing ligands were the same as in Table 3 and Table 4.

