
Figure 2.
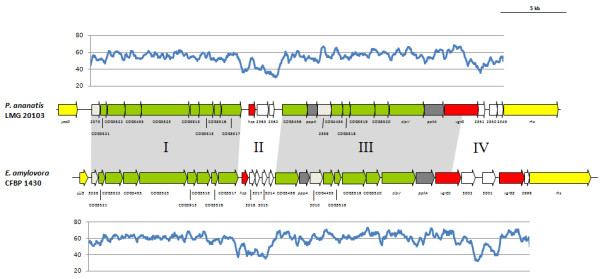
The T6SS-1 loci of P. ananatis LMG 20103 and E. amylovora CFBP 1430. The conserved regions (block I and III) are shaded in gray, while the non-conserved hcp and vgrG islands are not shaded. Genes encoding conserved domain proteins are represented by green arrows while the grey arrows indicate other genes conserved among the Pantoea and Erwinia T6SS-1 loci which were not identified as part of the conserved core described by Boyer et al. [15]. Red arrows represent the hcp and vgrG genes while genes not conserved among the Pantoea and Erwinia species are colored in white. Graphs show the G+C content (%) (window size = 50 bp, step = 10 bp) in the respective T6SS-1 loci.