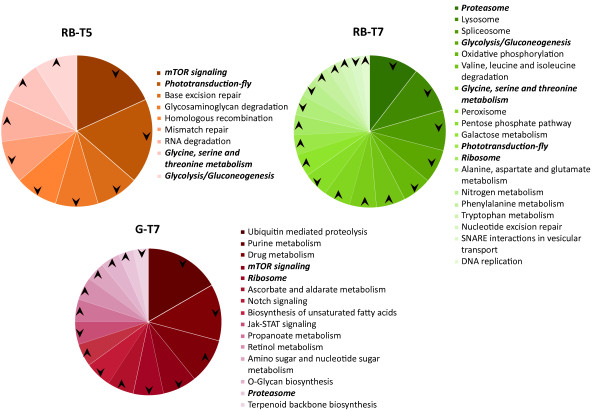
Figure 3.
KEGG pathway analysis on differentially regulated genes across gossypol dose-tissue experimental conditions. Charts depict the proportion of genes, using fruit fly gene homology to H. armigera ESTs represented in the microarray, belonging to pathways occurring more or less frequently than expected in the test group relative to control (gossypol-free diet). Arrows indicate directionality of regulation for the corresponding genes in the pathway associated with significant z-scores (minimum number in gene set = 10) (Tissue: G = gut, RB = rest of body; Gossypol concentration: T5 = 0.016%, T7 = 0.16%).

