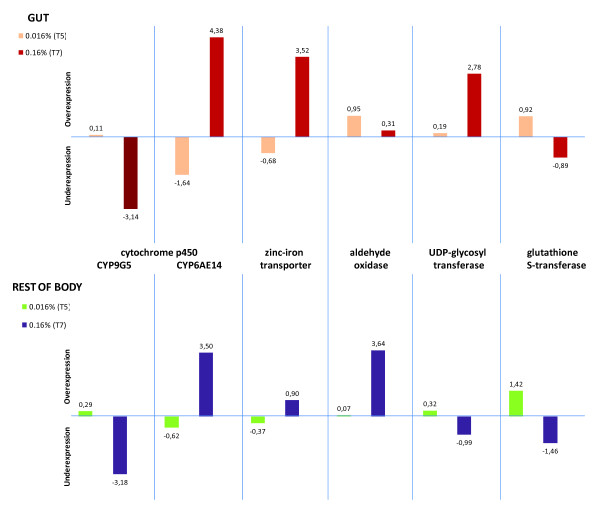
Figure 5.
Transcriptional response of a selection of putative detoxification genes across experimental conditions. Gene expression was found to be differentially regulated by the Rank Products method. The average of the normalized log-ratios across biological replicates for two probes representing each gene is plotted. The ratio is represented by either T5 (0.016%) or T7 (0.16%) over the control (0% gossypol) across tissues.

