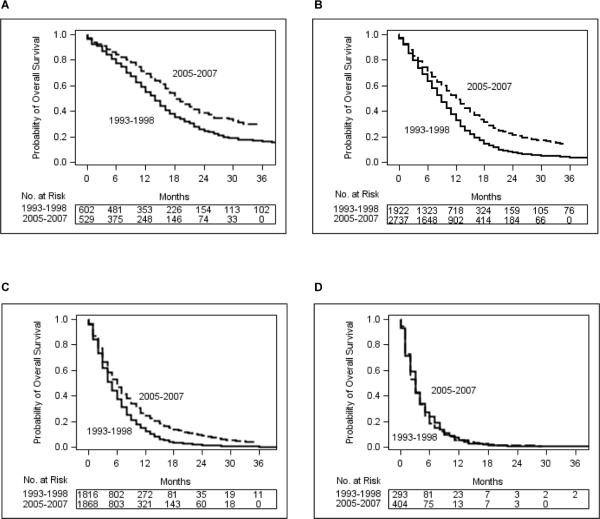
Figure 2.
Kaplan-Meier survival plots for glioblastoma multiforme cases according to year of diagnosis and age. The x-axes indicate completed months of follow-up. SEER provides follow-up time in number of completed months. Cases who survived at least n months, but fewer than n+1 months, would have n completed months of survival, which corresponds with “n.5” months, on average. Thus, the probability of surviving at least two years (24 completed months), for example, represents the probability of surviving at least 24.5 months, on average. Age group: (A) 20–44 years. (B) 45–64 years. (C) 65–79 years. (D) 80+ years.

