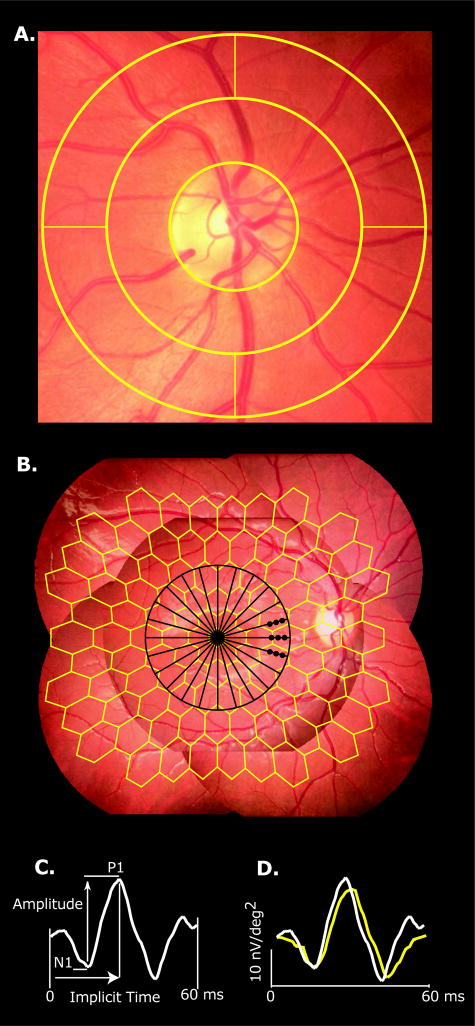
Figure 1.
Retinal Vessel Analysis and Multifocal Electroretinogram (mfERG). (A) Retinal blood vessels within outer annulus (½ to 1 disc diameter around the optic nerve) were analyzed with IVAN (University of Wisconsin-Madison, WI), an automated but supervised program. (B) Five field fundus mosaic depicting the retinal regions measured with the 103 mfERG stimulus pattern (yellow). Black 12 radial scans underlying the retinal thickness map. Black dots indicate the 9 samples used for retinal nerve fiber analysis. (C) Amplitude is the voltage difference between the N1 trough and P1 peak; implicit time is measured from the onset of the local flash to the P1 peak. (D) Example waveforms obtained from a normal control subject (white trace) and a subject with diabetes (yellow trace).

