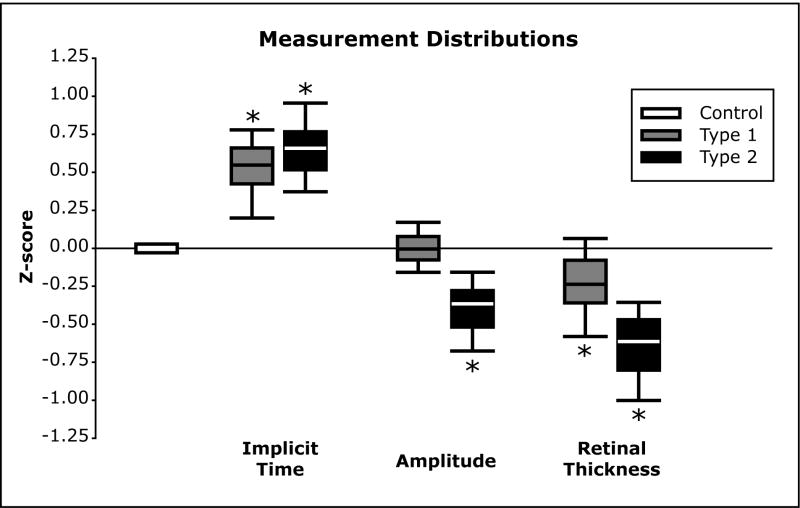
Figure 2.
Response Z-score Distributions for Average Eyes. Box plots represent the 5th, 25th, 50th, 75th and 95th percentiles. Control distributions for each measure are centered on a Z-score of zero. (Implicit Time) The implicit time distributions of the type 1 and type 2 groups were all significantly delayed compared to the control distribution (Tukey WSD). (Amplitude) The amplitude distribution of the type 2 group differed significantly from both the type 1 and controls (Tukey WSD). (Retinal Thickness) The retinal thickness distributions of both the type 1 and type 2 groups were significantly thinner than the control group (Tukey WSD). The (*) indicates a significant difference from controls.

