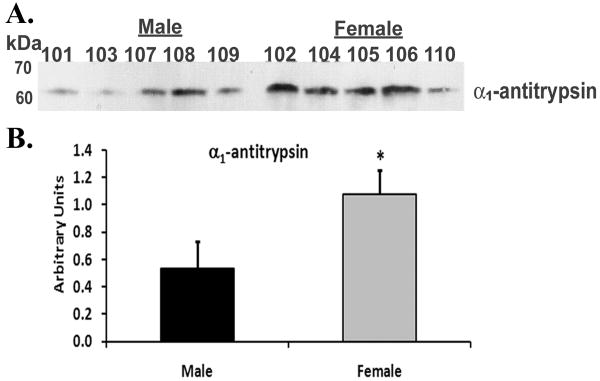
Figure 1. Immunoblot of α1-antitrypsin from plasma of females vs. males.
Plasma proteins were separated by 10% SDS polyacrylamide electrophoresis, transferred to nitrocellulose and α1-antitrypsin immunoreactivity (panel A) was visualized by western blotting. In the aggregate there is more total immunoreactivity for α1-antitrypsin in female plasma, vs. male plasma, as documented by the densitometry of the resulting bands of immunoreactivity depicted in the bar graph (panel B). This figure is representative of two separate experiments.

