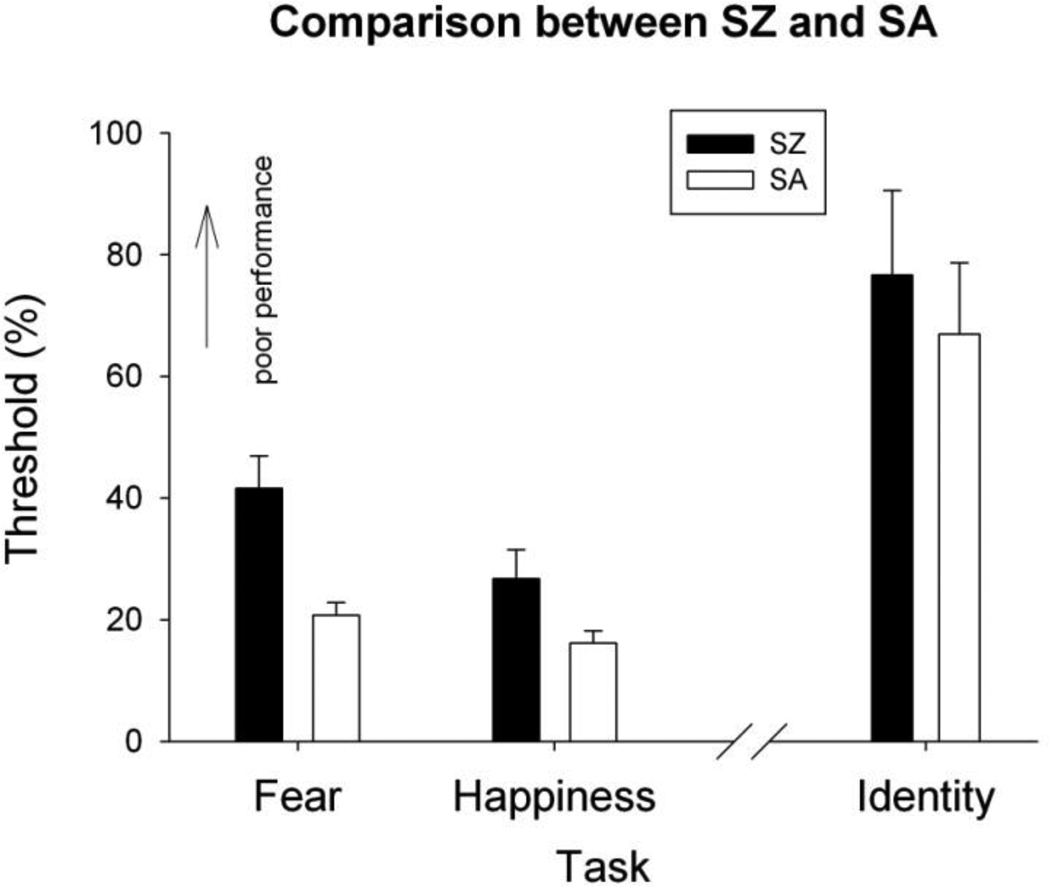
Figure 3.
Comparison of the thresholds in fear, happiness and identity discrimination. The x-axis indicates the type of face perception tasks and the y-axis indicates the threshold values. The higher value a threshold has, the worse performance it represents. The error bars represent ±1 standard error.

