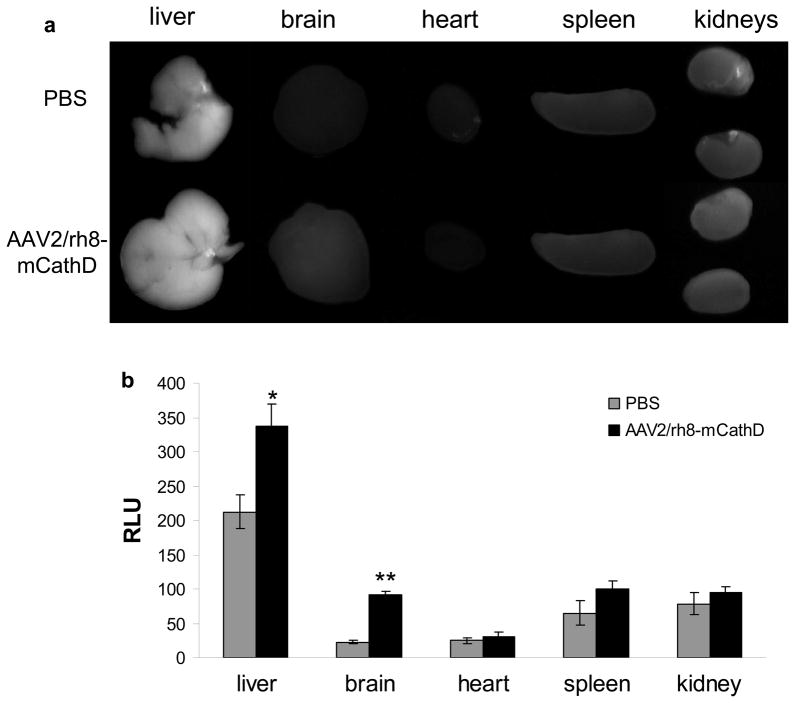
Figure 4.
NIRF imaging of CathD activity ex vivo. Neonatal pups were injected with AAV2/rh8-mCathD vector both i.c.v. (2 × 10¹⁰ g.c into each ventricle in 2 μl 0.06% Trypan blue) and i.p. (1 × 10¹⁰ g.c in 100 μl) on P1. Similar groups of mice were injected with PBS (n = 6/group). On P24 (2–3 days prior to mortality in knock-out animals), mice were injected i.p. with NIRF probe (0.1 nmoles/g body weight) and sacrificed 24 h later with PBS perfusion. Liver, brain, heart, spleen and kidneys were removed, rinsed with PBS, and imaged at 5 different regions of interests using a custom-built camera system followed by image analysis using Kodak Digital Science 1D software. B).(A) representative organs from a single mouse in each group is shown.(B) Signal intensity is expressed as the average relative light units (RLU) ± S.D. (n = 6). Significant increases in AAV-mCathD treated animals were seen for liver (*p<0.0001) and brain (**p<0.00001) as calculated by student t-test.

