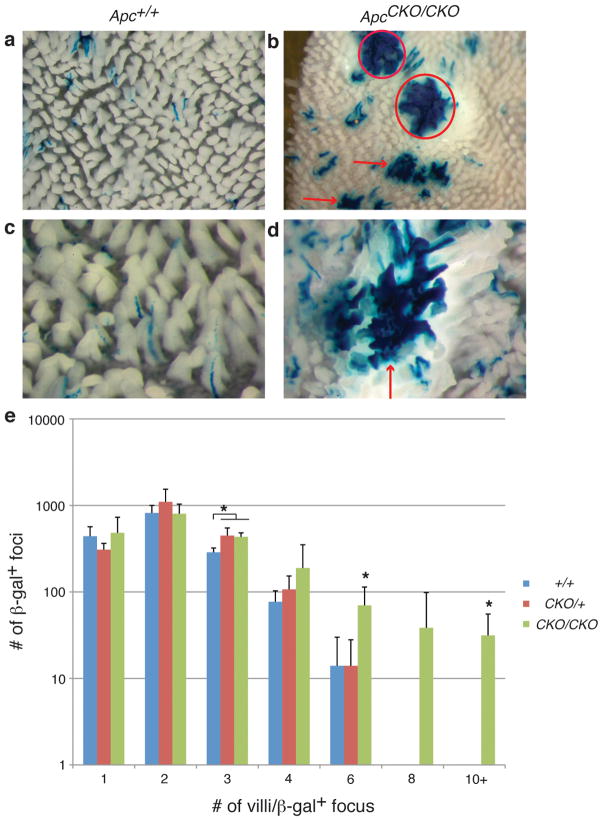
Figure 2. Increased number of larger β-gal+ foci in ApcCKO/CKO mice.
(a–d) Whole mount images of proximal small intestine of Apc+/+ and ApcCKO/CKO mice. Adenomas denoted with circles and larger normal β-gal+ foci with arrows. (b, d) Images showing examples of larger normal β-gal+ foci in ApcCKO/CKO mice. (e) Distribution of β-gal+ foci sizes in the proximal small intestine of Apc+/+, ApcCKO/+ and ApcCKO/CKO mice. ApcCKO/+ and ApcCKO/CKO mice show a significant increase in β-gal+ foci involving 3 villi (p=0.01). ApcCKO/CKO show a significant increase in β-gal+ foci involving 6 and 10 or more villi (p=0.02 and p=0.03, respectively).

