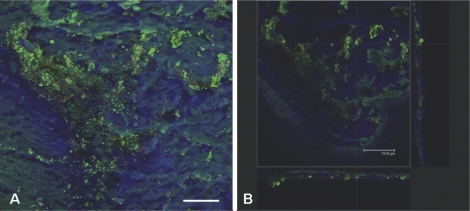
Figure 2.
CLSM images of biofilm on soft tissue from patient 2. Overlay projection of the biofilm (A) and a projected side-view (B), meaning the biofilm is visualized from the top and from the side (XZ-plane and YZ-plane, respectively). Bar represents 75 µm. CLSM examination showed that the biofilm distribution was patchy (panel A), with some sites containing large clusters of bacteria and other regions showing hardly any evidence of infection. The bacteria were frequently embedded within a self-produced matrix of EPS (panel B). In addition, the infected ulcer was quite superficial, as can be concluded from the biofilm thickness shown in panel B.

