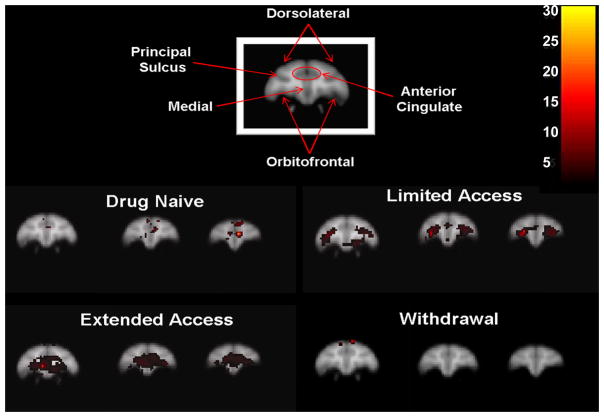
Figure 3.
Cocaine-induced (1.0 mg/kg, i.m.) activation within the prefrontal cortex following each cocaine access condition. Images for each condition represent 2mm coronal sections anterior (left to right) from the first appearance of the orbitofrontal cortex. Inset color scale represents the degree of statistical significance expressed in multiples of the t statistic value.

