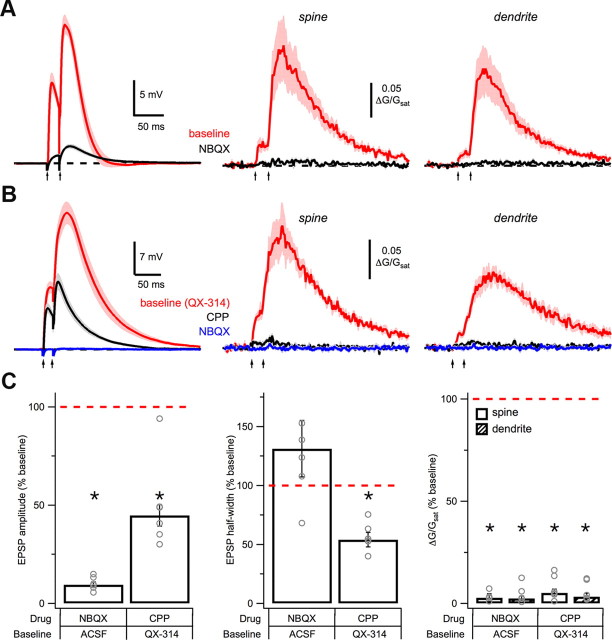
Figure 5.
Postsynaptic depolarization. A, Average EPSPs (left) and Ca signals in spines (middle) and dendrites (right) in response to high-intensity, paired-pulse stimulation (arrows) in baseline conditions (red) and after wash-in of 10 μm NBQX (black). B, As in A, but with internal 5 mm QX-314 in baseline conditions (red), and sequential wash-in of 10 μm CPP (black) and 10 μm NBQX (blue). C, Summary of impact of CPP and NBQX on EPSP amplitude (left), EPSP half-width (middle), and Ca signals (right) in spines (open) and dendrites (hash), in the different baseline conditions. Asterisks indicate significant difference from 100% (p < 0.05).

