
Fig. 6.
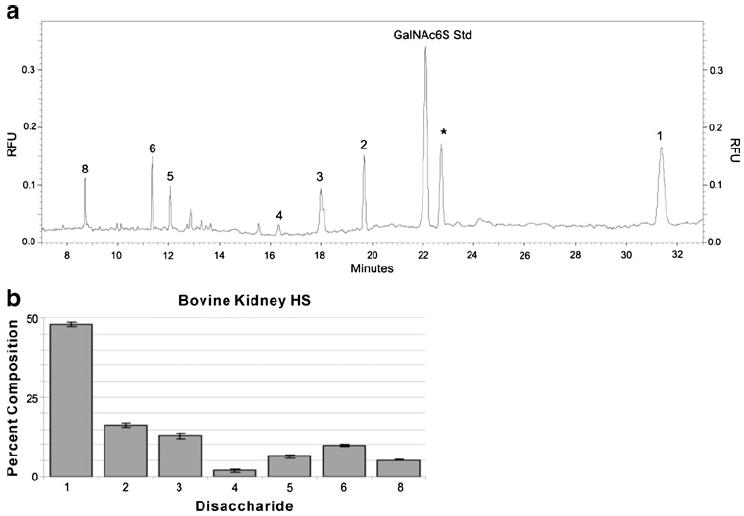
a–b Analysis of bovine kidney HS. a Electropherogram (obtained by performing CE-LIF in reversed-polarity mode) of bovine kidney HS (0.05 μg) subjected to exhaustive heparinase-catalyzed depolymerization, optimized AMAC derivatization, and cellulose cleanup. The disaccharide peaks are labeled with numbers that correspond to the structures shown in Table 1. The asterisk represents an unidentified peak deriving from the bovine HS sample. b Bar graph representation of the CE-LIF disaccharide analysis of bovine kidney HS. Adapted from [95] with permission