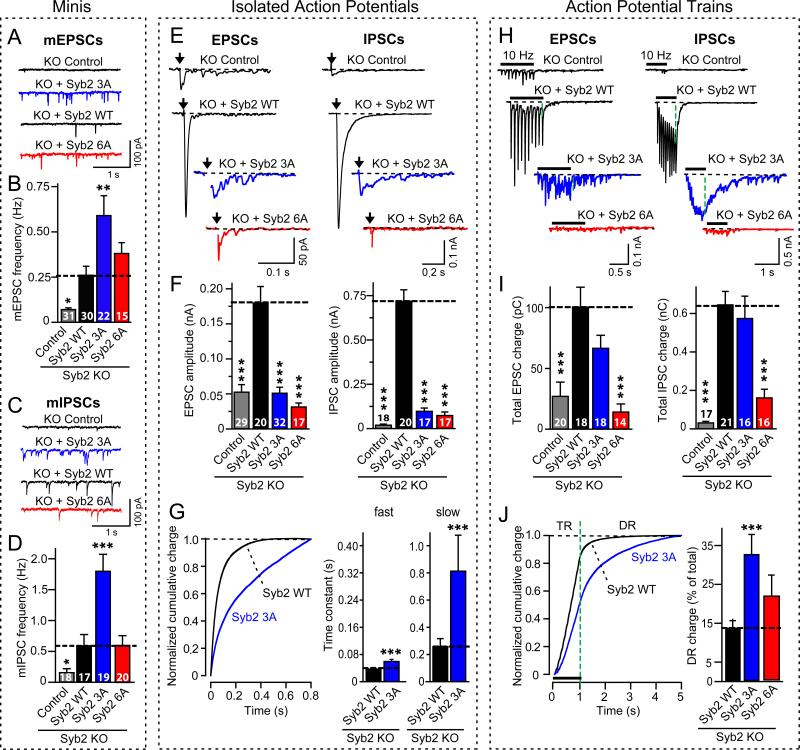
Figure 2. Blocking complexin-binding to SNARE complexes increases spontaneous fusion but suppresses fast Ca2+-evoked fusion.
Synaptobrevin-2 KO neurons were infected with lentiviruses expressing GFP only (control), or wild-type (Syb2 WT), 3A-mutant (Syb2 3A), or 6A-mutant synaptobrevin-2 (Syb2 6A). The 3A-mutation in synaptobrevin selectively blocks complexin-binding to SNARE complexes, whereas the 6A-mutation additionally impairs SNARE-complex assembly (Figs. S6 and S7).
A-D, Representative traces (A, C) and frequencies (B, D) of spontaneous mEPSCs (A,B) and mIPSCs (C,D). For mini amplitudes, see Fig. S8.
E and F, Representative traces (E) and mean amplitudes (F) of EPSCs (left) and IPSCs (right) evoked by isolated action potentials at 0.1 Hz.
G, Timecourse of isolated IPSCs monitored in synaptobrevin-2 KO neurons expressing wild-type (Syb2 WT) or 3A-mutant synaptobrevin-2 (Syb2 3A). The timecourse was analyzed as the cumulative normalized charge transfer (left), and fitted to a two-exponential equation yielding time constants of fast and slow release phases (right; see Fig. S9 illustrating scaled superimposed IPSC traces).
H and I, Representative traces (H) or mean synaptic charge transfer (I) of EPSCs (left) and IPSCs (right) evoked by 10 Hz action potential trains (see Fig. S10 for quantitations of charge transfers).
J, Timecourse of the cumulative IPSC charge transfer during the 10 Hz stimulus train. Left, plots of the cumulative normalized charge transfer allow quantitation of train release (TR) and delayed release (DR; shown only for neurons expressing wild-type or 3A-mutant synaptobrevin-2); right, bar diagram of the contribution of delayed release to the total synaptic charge transfer in neurons expressing wild-type (Syb2 WT), 3A-mutant (Syb3 3A), and 6A-mutant synaptobrevin-2 (Syb2 6A).
All scale bars apply to all traces in a series; all bar diagrams depict means±SEMs; statistical significance was evaluated by ANOVA in comparison to wild-type synaptobrevin-2: *** = p<0.001; total number of analyzed neurons in 5-6 independent cultures are shown in the summary bars).

